Friday, August 28, 2009
Defensive Systems and their Impact on Shot Location
As we saw a few weeks ago, Jacques Lemaire’s defensive system substantially limits the rate at which opponents take high-percentage shots against his teams. This effect has been persistent over the course of nearly a decade. This made me wonder what impact other coaches have on shots faced by their teams.
What the chart below shows is - for each coach in all years that he coached - the difference between league-wide save percentage and the save percentage each team expected given the shots they allowed.
As you can see, Lemaire stands out, though it would be interesting to see how the shot location chart looks for Hitchcock's teams. Bob Hartley brings up the rear for coaches who coached four seasons or more - his poor performance may be entirely due to having Ilya Kovalchuk on the ice most of the game.
What the chart below shows is - for each coach in all years that he coached - the difference between league-wide save percentage and the save percentage each team expected given the shots they allowed.
Coach      +EXS% YRS
Lemaire     4.3  7
Hitchcock   3.4  5
B. Sutter   2.8  5
Mactavish   2.0  7
Julien      2.0  4
Trotz       1.7  7
Martin      1.3  6
Wilson      1.2  6
Ruff        0.9  7
Quinn       0.8  4
Tippett     0.3  6
Crawford   -0.8  6
Tortorella -1.0  6
Maurice    -1.0  4
Carlyle    -1.3  4
Gretzky    -1.5  4
Quenneville-1.7  6
A. Murray  -2.3  6
Babcock    -2.3  6
Laviolette -3.2  5
Hartley    -3.5  4
As you can see, Lemaire stands out, though it would be interesting to see how the shot location chart looks for Hitchcock's teams. Bob Hartley brings up the rear for coaches who coached four seasons or more - his poor performance may be entirely due to having Ilya Kovalchuk on the ice most of the game.
Wednesday, April 16, 2008
How does an NHL coach's age affect his performance?
Thanks to hockey-reference.com's new and better-organized data, I was able to hammer out a project I've been thinking about for months in about half an hour yesterday. I read a baseball article about managerial aging patterns and I wanted to see what role a coach's age played in the NHL.
What I did was as follows: at each age, I totaled the number of points a coach's team got in the standings and compared that to the number of points we would have expected based on their goals for and against. The idea is that coaches reach some peak performance level where they can get their teams to produce better results than what their raw goal differential would suggest. No one has ever coached an NHL team at age 25 or age 70, so clearly there is skills growth and decline among the coaching population.
The dataset starts in 1967 and ends in 2004 (because goal totals post-lockout include phantom SO winners.) This chart shows that delta on a per game basis:
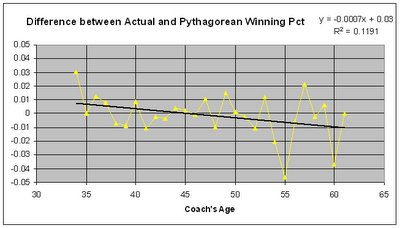
One thing that's obvious is that once coaches reach their mid-fifties they can potentially fall off a cliff. Beyond age 61, coaching is really the exclusive province of Scotty Bowman and Roger Neilson. But for the bulk of their careers - age 35 to 53, which accounts for 86% of all games coached - there is, to my eye, and my spreadsheet, no discernible trend. The only thing I see is that coaches aged 54-61 accounted for 10% of games coached despite the variation in their performance, which suggests that legendary coaches are allowed to stay on until they run their teams into the ground, rather than being asked to retire at the beginning of their decline phase.
What I did was as follows: at each age, I totaled the number of points a coach's team got in the standings and compared that to the number of points we would have expected based on their goals for and against. The idea is that coaches reach some peak performance level where they can get their teams to produce better results than what their raw goal differential would suggest. No one has ever coached an NHL team at age 25 or age 70, so clearly there is skills growth and decline among the coaching population.
The dataset starts in 1967 and ends in 2004 (because goal totals post-lockout include phantom SO winners.) This chart shows that delta on a per game basis:
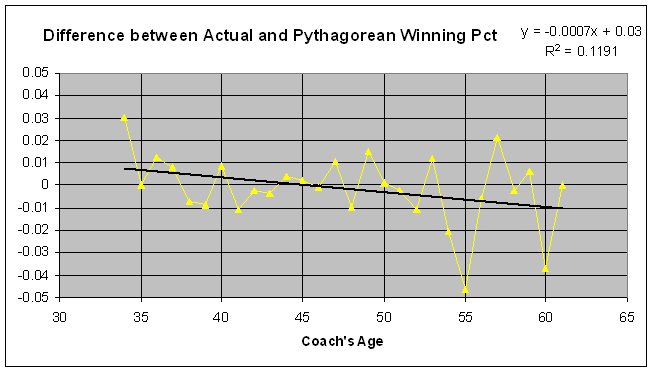
One thing that's obvious is that once coaches reach their mid-fifties they can potentially fall off a cliff. Beyond age 61, coaching is really the exclusive province of Scotty Bowman and Roger Neilson. But for the bulk of their careers - age 35 to 53, which accounts for 86% of all games coached - there is, to my eye, and my spreadsheet, no discernible trend. The only thing I see is that coaches aged 54-61 accounted for 10% of games coached despite the variation in their performance, which suggests that legendary coaches are allowed to stay on until they run their teams into the ground, rather than being asked to retire at the beginning of their decline phase.
Labels: Aging, Coaching, Hockey-reference
![]()
Subscribe to Posts [Atom]
