Tuesday, September 15, 2009
Top Scorers on Rebounds, 2005-09
The NHL statistical database has been consistent for the four seasons since the lockout (Missed Shots were excluded in the two seasons prior to it). Here are the rebound scoring leaders:
The worst? Alexei Kovalev, with just one goal on 42 total rebounds...
Player     Shot  G  SOG  MS
Parise     73   22  41   10
Svatos     49   20  23    6
E Staal    81   19  50   12
Frolov     53   18  28    7
Antropov   50   17  26    7
Jokinen    73   17  43   13
Gomez      47   16  23    8
Zubrus     47   16  18   13
Arnott     54   16  29    9
D. Roy     56   16  28   12
Vermette   63   16  36   11
The worst? Alexei Kovalev, with just one goal on 42 total rebounds...
Friday, August 28, 2009
Defensive Systems and their Impact on Shot Location
As we saw a few weeks ago, Jacques Lemaire’s defensive system substantially limits the rate at which opponents take high-percentage shots against his teams. This effect has been persistent over the course of nearly a decade. This made me wonder what impact other coaches have on shots faced by their teams.
What the chart below shows is - for each coach in all years that he coached - the difference between league-wide save percentage and the save percentage each team expected given the shots they allowed.
As you can see, Lemaire stands out, though it would be interesting to see how the shot location chart looks for Hitchcock's teams. Bob Hartley brings up the rear for coaches who coached four seasons or more - his poor performance may be entirely due to having Ilya Kovalchuk on the ice most of the game.
What the chart below shows is - for each coach in all years that he coached - the difference between league-wide save percentage and the save percentage each team expected given the shots they allowed.
Coach      +EXS% YRS
Lemaire     4.3  7
Hitchcock   3.4  5
B. Sutter   2.8  5
Mactavish   2.0  7
Julien      2.0  4
Trotz       1.7  7
Martin      1.3  6
Wilson      1.2  6
Ruff        0.9  7
Quinn       0.8  4
Tippett     0.3  6
Crawford   -0.8  6
Tortorella -1.0  6
Maurice    -1.0  4
Carlyle    -1.3  4
Gretzky    -1.5  4
Quenneville-1.7  6
A. Murray  -2.3  6
Babcock    -2.3  6
Laviolette -3.2  5
Hartley    -3.5  4
As you can see, Lemaire stands out, though it would be interesting to see how the shot location chart looks for Hitchcock's teams. Bob Hartley brings up the rear for coaches who coached four seasons or more - his poor performance may be entirely due to having Ilya Kovalchuk on the ice most of the game.
Wednesday, August 19, 2009
New Puck Prospectus Article: Shot Quality and the Minnesota Wild
Niklas Backstrom is a mystery to me - is he a great goalie? Or did Minnesota limit his exposure. The Wild's Chris Snow clearly feels that both are true. Depending on your angle, the numbers back up both opinions.
Shot Quality and the Minnesota Wild
I've written about this topic from various angles, here and here.
Shot Quality and the Minnesota Wild
I've written about this topic from various angles, here and here.
Labels: Puck Prospectus, Shooting
Saturday, August 1, 2009
Defenseman's Impact (cont'd...)
I was initially only going to look at the performance of replacement level defensemen to see if their inclusion in the lineup had any additional negative impact relative to that of losing a #1 or #2 defenseman. But I ended up pulling the "With or Without You" data for every defenseman over the last four seasons who played between 10 and 70 games in a season. That ended up being 502 in all.
I looked at two quantities: Even-Strength Save Percentage For and Even-Strength Save Percentage Against, both when the player was in the lineup and when he was out. I then regressed against average TOI. What we get is essentially this, with the coefficients varying slightly depending on how I weight the data:
Opponent's Save Percentage Delta vs Avg TOI = -0.44 * (TOI - 15)
Own Team's Save Percentage Delta vs Avg TOI = +0.44 * (TOI - 15)
TOI isn't a perfect proxy for a defenseman's ability (or for a team's performance when he's in the lineup), so we end up with R^2 in the range of 0.3 to 0.5. Nonetheless, replacing a good defenseman with a bad one tends to decrease your team's shooting percentage and increase your opponent's.
Labels: Replacement Level, Shooting
Wednesday, July 29, 2009
Defenseman's impact on Offense
I might as well re-run the previous post on the offensive end of the ice:
Again, the "Better +/-" group had a significant impact on scoring when they were in the lineup: +14.5 goals per 82 games. The "Worse" group generated more shots on goal, but scored less often, resulting in no increase in scoring.
As a whole, here are the offensive and defensive contributions in and out of the lineup:
So we get what we expect when the players are in the lineup: the expected record of a large number of teams is .500. When a top D-man is out of the lineup, both offensive and defensive shot volume and quality suffer to varying degrees, resulting in a .450 team in the aggregate. The difference between these two teams is approximately 8.66 points in the standings, or a little more than four wins. This seems like a reasonable estimate of the value of the average #1 or #2 defenseman.
If we look purely at the change in goals allowed due to not having one good defenseman in particular in the lineup, it accounts for approximately six goals per season. The difference in expected save percentage between the best and worst defensive teams using a simple shot quality model (see: http://www.behindthenet.ca/2008/5_on_5_goalie_shot_quality.php?sort=7&mingp=20) translates to approximately 20-25 goals per 82 games. If we assume that having neither a #1 or #2 defenseman on your team costs you twelve goals on shooting percentage alone, it seems unlikely that much more than half of this 20-25 goal difference is due to a weak defensive corps.
                       IN                        OUT
                  GP   G/GP  S+G/GP  SVPCT  GP   G/GP  S+G/GP  SVPCT  DELTA
N=28 Better +/-   1610 1.89  21.77   913.3  686  1.71  21.16   919.1   5.8
N=25 Worse +/-    1229 1.81  21.76   916.9  821  1.81  21.32   914.9   -2.0
Again, the "Better +/-" group had a significant impact on scoring when they were in the lineup: +14.5 goals per 82 games. The "Worse" group generated more shots on goal, but scored less often, resulting in no increase in scoring.
As a whole, here are the offensive and defensive contributions in and out of the lineup:
                       IN                         OUT
                  GP   G/GP  S+G/GP  SVPCT  GP    G/GP  S+G/GP  SVPCT  DELTA
Offense/GF        2839 1.86  21.77   914.9  1507  1.77  21.25   916.8   1.9
Defense/GA        2839 1.86  21.79   914.5  1507  1.95  21.97   911.0   3.5
So we get what we expect when the players are in the lineup: the expected record of a large number of teams is .500. When a top D-man is out of the lineup, both offensive and defensive shot volume and quality suffer to varying degrees, resulting in a .450 team in the aggregate. The difference between these two teams is approximately 8.66 points in the standings, or a little more than four wins. This seems like a reasonable estimate of the value of the average #1 or #2 defenseman.
If we look purely at the change in goals allowed due to not having one good defenseman in particular in the lineup, it accounts for approximately six goals per season. The difference in expected save percentage between the best and worst defensive teams using a simple shot quality model (see: http://www.behindthenet.ca/2008/5_on_5_goalie_shot_quality.php?sort=7&mingp=20) translates to approximately 20-25 goals per 82 games. If we assume that having neither a #1 or #2 defenseman on your team costs you twelve goals on shooting percentage alone, it seems unlikely that much more than half of this 20-25 goal difference is due to a weak defensive corps.
Labels: Replacement Level, Shooting
Monday, July 27, 2009
Shooting Percentage Estimation Errors
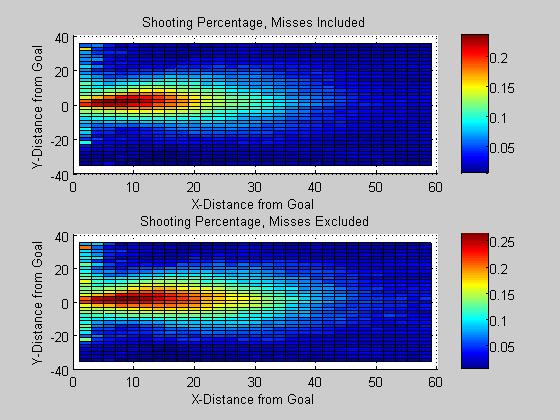
I recently found location data for missed shots going back four years, so I decided to compare shooting percentage estimates with and without missed shots. When missed shots are included, the high shooting percentage in the slot decreases substantially in size:
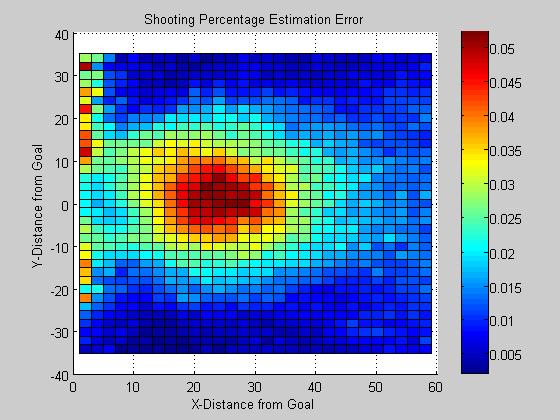
We can see where the estimate error is largest by subtracting the dataset that includes misses from the one that doesn't:

So by failing to include missed shots, we've substantially overestimated the shooting percentage in the high slot, 20 to 30 feet out from the goal. We can also express the error as a percentage:
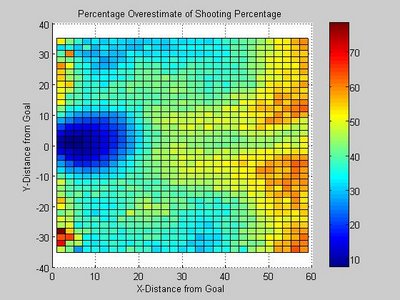
This gives a different result - shots from the blue line are much less likely to go in than we would otherwise think. If we had location data for shots that get blocked (we only know where they were blocked, not where they were shot from), we'd probably find that we're making an even larger overestimate.
We can see where the estimate error is largest by subtracting the dataset that includes misses from the one that doesn't:
So by failing to include missed shots, we've substantially overestimated the shooting percentage in the high slot, 20 to 30 feet out from the goal. We can also express the error as a percentage:

This gives a different result - shots from the blue line are much less likely to go in than we would otherwise think. If we had location data for shots that get blocked (we only know where they were blocked, not where they were shot from), we'd probably find that we're making an even larger overestimate.
Labels: Shooting
Friday, April 24, 2009
2008-09 5v5 Goaltender Performance
Last year, I posted my methodology for calculating the quality of shots faced by a goaltender, along with the results of this analysis.
The 2008-09 results are below (minimum 700 minutes played at 5v5). The last column, DELTAGAA, shows how much lower a goaltender's Goals-Against-Average was than we would expect it to be given the shots he faced. Henrik Lundqvist, Tim Thomas and Jonas Hiller are the only goaltenders who appear in the Top 10 both this year and last year.
At any rate, here are the top 10:
Full stats for this season and last available at: http://www.behindthenet.ca/2008/5_on_5_goalie_shot_quality.php?sort=10
The 2008-09 results are below (minimum 700 minutes played at 5v5). The last column, DELTAGAA, shows how much lower a goaltender's Goals-Against-Average was than we would expect it to be given the shots he faced. Henrik Lundqvist, Tim Thomas and Jonas Hiller are the only goaltenders who appear in the Top 10 both this year and last year.
At any rate, here are the top 10:
NAME                GP   SPCT   GAA    ExSPT  ExGAA   DELTAGAA
TIM THOMAS          54   937    1.87   911    2.64     -0.77
NIKOLAI KHABIBULIN  42   927    1.94   902    2.64     -0.70
ROBERTO LUONGO      54   931    1.90   906    2.59     -0.69
HENRIK LUNDQVIST    69   913    2.38   890    3.00     -0.63
TOMAS VOKOUN        59   931    2.25   913    2.84     -0.59
KARI LEHTONEN       46   917    2.73   900    3.29     -0.56
JONAS HILLER        46   927    1.90   906    2.46     -0.56
MARTIN BRODEUR      31   930    1.90   912    2.38     -0.49
CRAIG ANDERSON      31   922    2.62   909    3.09     -0.47
MANNY FERNANDEZ     28   921    2.18   905    2.64     -0.45
Full stats for this season and last available at: http://www.behindthenet.ca/2008/5_on_5_goalie_shot_quality.php?sort=10
Labels: Goaltending, Shooting
Sunday, June 15, 2008
2007-08 5v5 Goaltender Performance (Full Season)
I finally ran the full-season's worth of shot quality/goaltending statistics (see Mid-Season stats.) There was some discussion over at James Mirtle's site, with some people claiming that Evgeni Nabokov was deserving of the Vezina Trophy - and not Martin Brodeur. The stats don't bear that out:
Brodeur faced tougher shots than Nabokov, and did a way better job of stopping them. There's no way to argue from a shot quality perspective that Nabokov deserves the award.
Here's the rest of the league, minimum 20 GP:
Nabokov Expected Save PCT 909, Actual 908 - GAA 0.03 higher than average goaltender
Brodeur Expected Save PCT 906, Actual 920 - GAA 0.34 *lower* than average goaltender
Brodeur faced tougher shots than Nabokov, and did a way better job of stopping them. There's no way to argue from a shot quality perspective that Nabokov deserves the award.
Here's the rest of the league, minimum 20 GP:
           GP TOI     SOG  GA SPCT GAA  EGA  ESPT EGAA DELTAGAA
DUBIELEWICZ20 787:01  394  31  921 2.36 41.1  895 3.13 -0.77
LUNDQVIST  72 3063:24 1201 99  917 1.94 137   885 2.68 -0.74
GIGUERE    58 2287:15 1001 65  935 1.71 92.97 907 2.44 -0.73
HILLER     23 863:21  354  27  923 1.88 37.02 895 2.57 -0.7
FLEURY     35 1285:49 614  41  933 1.91 53.92 912 2.52 -0.6
THOMAS     57 2465:18 1186 83  930 2.02 105.8 910 2.58 -0.56
CONKLIN    33 1311:57 714  47  934 2.15 58.5  918 2.68 -0.53
BRYZGALOV  64 2578:31 1266 91  928 2.12 112.3 911 2.61 -0.5
PRICE      41 1669:29 837  63  924 2.26 75.77 909 2.72 -0.46
LEHTONEN   48 1953:15 1066 88  917 2.7  102.2 904 3.14 -0.43
HUET       52 2170:39 1013 77  923 2.13 91.53 909 2.53 -0.4
BRODEUR    77 3392:35 1386 110 920 1.95 129.5 906 2.29 -0.34
LEGACE     66 2616:37 1084 88  918 2.02 102.4 905 2.35 -0.33
HASEK      41 1587:27 545  42  922 1.59 50.68 907 1.92 -0.33
ELLIS      44 1584:18 805  62  922 2.35 70.76 912 2.68 -0.33
TELLQVIST  22 871:55  413  33  920 2.27 37.57 909 2.59 -0.31
KHABIBULIN 50 1943:04 850  77  909 2.38 86.75 897 2.68 -0.3
OSGOOD     43 1728:03 663  58  912 2.01 66.61 899 2.31 -0.3
AULD       32 1199:26 520  42  919 2.1  47.57 908 2.38 -0.28
VOKOUN     69 2910:13 1510 122 919 2.52 134.5 910 2.77 -0.26
LUONGO     73 2908:45 1318 103 921 2.12 115.7 912 2.39 -0.26
GERBER     57 2248:37 1086 94  913 2.51 103.2 905 2.75 -0.24
BIRON      62 2427:39 1241 95  923 2.35 103.5 916 2.56 -0.21
DIPIETRO   63 2631:01 1173 106 909 2.42 114.4 902 2.61 -0.19
LALIME     32 1267:26 561  54  903 2.56 57.76 897 2.73 -0.18
NIITTYMAKI 28 938:43  474  45  905 2.88 47.46 899 3.03 -0.16
THEODORE   53 2243:30 967  87  910 2.33 92.65 904 2.48 -0.15
LABARBERA  45 1721:56 945  86  908 3.00 90.3  904 3.15 -0.15
TOSKALA    66 2720:58 1201 111 907 2.45 116.6 902 2.57 -0.12
KIPRUSOFF  76 3087:15 1379 118 914 2.29 123.7 910 2.40 -0.11
WARD       69 2718:41 1233 113 908 2.49 117.6 904 2.60 -0.1
LECLAIRE   54 2075:24 880  67  923 1.94 70.49 919 2.04 -0.1
TURCO      62 2556:30 1022 91  910 2.14 94.91 907 2.23 -0.09
MILLER     76 3130:07 1399 122 912 2.34 125.8 910 2.41 -0.07
BUDAJ      35 1405:13 587  52  911 2.22 52.53 910 2.24 -0.02
BACKSTROM  58 2441:35 1110 90  918 2.21 89.42 919 2.20 0.01
NABOKOV    77 3266:15 1190 109 908 2 10 7.49  909 1.97 0.03
NORRENA    37 1359:34 548  57  895 2.52 53.55 902 2.36 0.15
HARDING    29 1141:15 578  54  906 2.84 51.01 911 2.68 0.16
RAMO       22 954:17  453  46  898 2.89 43.27 904 2.72 0.17
MASON      51 1902:51 850  86  898 2.71 80.27 905 2.53 0.18
SABOURIN   24 854:58  383  38  900 2.67 35.36 907 2.48 0.19
KOLZIG     54 2292:20 929  98  894 2.57 89.88 903 2.35 0.21
SMITH      34 1433:34 597  64  892 2.68 58.21 902 2.44 0.24
ROLOSON    43 1670:23 795  79  900 2.84 71.72 909 2.58 0.26
EMERY      31 1205:08 505  52  897 2.59 46.44 908 2.31 0.28
GARON      47 1848:13 882  87  901 2.82 78.14 911 2.54 0.29
HEDBERG    36 1384:59 676  73  892 3.16 64.26 904 2.78 0.38
HOLMQVIST  47 1932:04 760  91  880 2.83 68.73 909 2.13 0.69
TOIVONEN   23 842:20  359  51  857 3.63 38.76 892 2.76 0.87
Labels: Goaltending, Shooting
Friday, December 28, 2007
Zetterberg vs Lecavalier defensively
There was a particularly insightful post over at Irreverent Oiler Fans comparing Henrik Zetterberg to Vincent Lecavalier. The gist of it is that their offensive stats may be comparable, but when you look at both +/- and shots directed at the net, Lecavalier is very weak defensively compared to Zetterberg.
If I run the 5v5 shot analysis from below on these two, I get something like this:
EXP GA is the expected number of goals allowed by each player, assuming a league average goaltender. EXP SPCT is the expected save percentage under those same conditions.
Two things come out of this data:
1) Lecavalier gives up a lot more shots on goal when he's on the ice than Zetterberg.
2) The shots Lecavalier gives up aren't better shots, but Tampa's goaltending is a lot worse than average, so it looks like opponents score a lot more when he's on the ice.
I think this is the best way to visualize the situation:
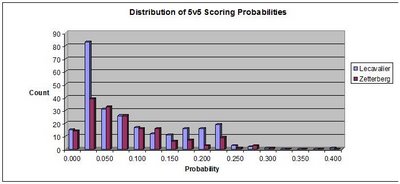
Lecavalier leads Zetterberg in two major categories of shots allowed: very high percentage shots (20% chance of scoring, usually within 10 feet of the goal) and low percentage shots (2.5% chance of scoring). Those two cases cancel each other out, so overall, the average opponent shot when Lecavalier is on the ice isn't any tougher for the goalie to handle. This shows up in the minimal difference in expected save percentage.
But that doesn't change the fact that Lecavalier simply allows a lot more shots when he's on the ice, and even if they're not tough to handle, he's going to allow a lot more goals than Zetterberg.
If I run the 5v5 shot analysis from below on these two, I get something like this:
| Player | GA | SA | SPCT | EXP GA | EXP SPCT |
| Lecavalier | 31 | 229 | 865 | 22.55 | 902 |
| Zetterberg | 16 | 164 | 902 | 14.37 | 912 |
EXP GA is the expected number of goals allowed by each player, assuming a league average goaltender. EXP SPCT is the expected save percentage under those same conditions.
Two things come out of this data:
1) Lecavalier gives up a lot more shots on goal when he's on the ice than Zetterberg.
2) The shots Lecavalier gives up aren't better shots, but Tampa's goaltending is a lot worse than average, so it looks like opponents score a lot more when he's on the ice.
I think this is the best way to visualize the situation:
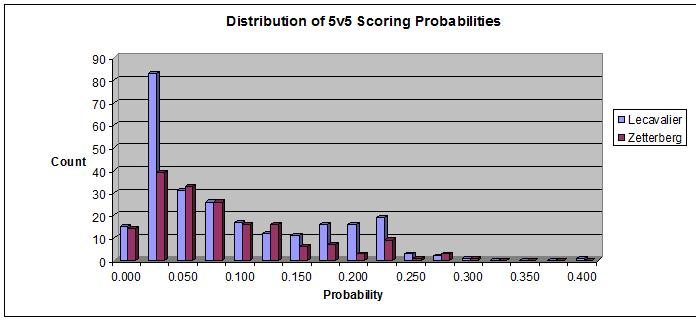
Lecavalier leads Zetterberg in two major categories of shots allowed: very high percentage shots (20% chance of scoring, usually within 10 feet of the goal) and low percentage shots (2.5% chance of scoring). Those two cases cancel each other out, so overall, the average opponent shot when Lecavalier is on the ice isn't any tougher for the goalie to handle. This shows up in the minimal difference in expected save percentage.
But that doesn't change the fact that Lecavalier simply allows a lot more shots when he's on the ice, and even if they're not tough to handle, he's going to allow a lot more goals than Zetterberg.
Labels: Shooting
Thursday, December 20, 2007
Shooting Percentage by Zone
I spend a lot of time looking at the NHL's data feed, and sometimes I forget that there's often more data available on ESPN's feed. In particular, while the NHL still only gives you shot distance but no angle information, this season, ESPN has the coordinates of every shot on goal. Here's last night's Anaheim-Colorado game, for example. This just serves to remind us that there's a lot more data being collected at every game than we could possibly imagine just from what's publicly-available.
At any rate, one of the things we'd like to know is how often a shot goes in from a given zone on the ice. This plot shows that percentage for even-strength and power-play situations:
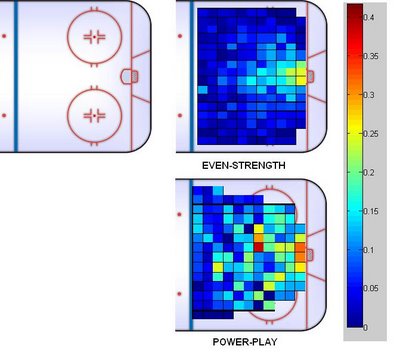
Note that if there were fewer than 20 shots taken so far this season in a given zone, it is not shown. Obviously, there's a tremendous amount we can do with this data, and I'm hoping to get around to that as soon as possible. In the interim, here are some sample shooting scatterplots, starting with the much-maligned Michael Ryder's even-strength shooting:

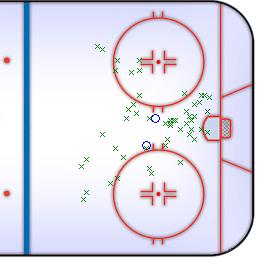
Compare to the somewhat inefficient Alexander Ovechkin at evens:
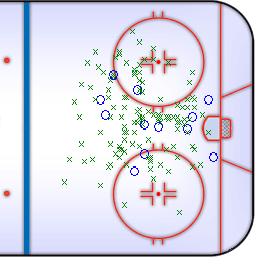
That's all for now. Much more later. If there's any shooting analysis you'd like to see, please post a comment.
At any rate, one of the things we'd like to know is how often a shot goes in from a given zone on the ice. This plot shows that percentage for even-strength and power-play situations:

Note that if there were fewer than 20 shots taken so far this season in a given zone, it is not shown. Obviously, there's a tremendous amount we can do with this data, and I'm hoping to get around to that as soon as possible. In the interim, here are some sample shooting scatterplots, starting with the much-maligned Michael Ryder's even-strength shooting:
Compare to the somewhat inefficient Alexander Ovechkin at evens:

That's all for now. Much more later. If there's any shooting analysis you'd like to see, please post a comment.
Labels: Shooting
Monday, December 3, 2007
Lay off Patrick Marleau
San Jose Sharks Captain Patrick Marleau has been taking a lot of flak for his play this year, and it's true, it all you looked at were his most basic stats, it doesn't seem like he's having a good year:
YEAR TEAM GP G A PTS SOG SPCT ESG ESA PPG PPA
2005-2006 SAN 82 34 52 86 260 13.1 14 28 20 24
2006-2007 SAN 77 32 46 78 180 17.8 18 23 14 23
2007-2008 SAN 24 4 7 11 46 8.7 4 3 0 4
But we can't honestly believe Marleau will continue to score on just 8.7% of his shots, half of his career level, can we? When questioned by the San Jose Mercury News, Marleau doesn't believe it:
"The puck just isn't going into the net," Marleau said. "It's just one of those things that comes and goes. But it's not going to stay this way..."
One thing Marleau does exceedingly well is draw penalties. He was the best in the league (per 60 minutes) last season, and he's the best this season. And it's not even close. He draws penalties with speed and great moves - and that hasn't changed. There is no reason to think Marleau won't rack up a ton of points both at even-strength and on the power-play going forward.
![]()
Subscribe to Posts [Atom]
