Wednesday, July 29, 2009
Do Defensemen influence Save Percentage?
[Note: this methodology is similar to a previous analysis of replacement level: http://www.behindthenet.ca/blog/2008/04/replacement-level-how-many-wins-do.html. It is obvious that teams do worse when their top players are out of the lineup, but it's not clear what suffers.]
In order to answer this question, I made a list of defensemen over the last four seasons who averaged more than 22 minutes per game and played between 20 and 70 games in a given season. 22 minutes of TOI corresponds approximately to the 60th-best defenseman, which means that the group of subjects includes mostly 1st and 2nd defensemen.
I then counted up the number of even-strength goals and shots against when each defenseman was in the lineup and when he was not dressed. I further split the defensemen into those whose +/- was better than the team's overall +/- (on a per minute basis). Presumably the group with the "Better +/-" would have more of an impact on even-strength defensive zone play.
The results:
The assumption here is that during a given season, a player's aggregate group of teammates, including the goalie, will be basically unchanged whether he's in the lineup or not. Similarly, his team's aggregate group of opponents is assumed to be the same whether he's in the lineup or not.
While the defensive difference with the "Worse +/-" defensemen out of the lineup was negligible, the teams of the "Better +/-" defensemen allowed 15.5 fewer goals per 82 games when they were playing. One-quarter of this change was due to reducing the volume of shots allowed, but the rest is due to better save percentage.
In order to answer this question, I made a list of defensemen over the last four seasons who averaged more than 22 minutes per game and played between 20 and 70 games in a given season. 22 minutes of TOI corresponds approximately to the 60th-best defenseman, which means that the group of subjects includes mostly 1st and 2nd defensemen.
I then counted up the number of even-strength goals and shots against when each defenseman was in the lineup and when he was not dressed. I further split the defensemen into those whose +/- was better than the team's overall +/- (on a per minute basis). Presumably the group with the "Better +/-" would have more of an impact on even-strength defensive zone play.
The results:
                       IN                        OUT
                  GP   G/GP  S+G/GP  SVPCT  GP   G/GP  S+G/GP  SVPCT  DELTA
N=28 Better +/-   1610 1.85  21.48   914.0  686  2.04  21.94   907.2   5.8
N=25 Worse +/-    1229 1.89  22.20   915.1  821  1.89  22.00   914.2   0.9
The assumption here is that during a given season, a player's aggregate group of teammates, including the goalie, will be basically unchanged whether he's in the lineup or not. Similarly, his team's aggregate group of opponents is assumed to be the same whether he's in the lineup or not.
While the defensive difference with the "Worse +/-" defensemen out of the lineup was negligible, the teams of the "Better +/-" defensemen allowed 15.5 fewer goals per 82 games when they were playing. One-quarter of this change was due to reducing the volume of shots allowed, but the rest is due to better save percentage.
Labels: Goaltending, Replacement Level
Tuesday, July 14, 2009
Goaltender Pairs and 5v5 Rebounds
Here are all of the 2008-09 Goaltending pairs where shot totals were roughly even. Draw your own conclusions...
| Name | Team | SH | REB%<2 | REB%<4 | SPCT |
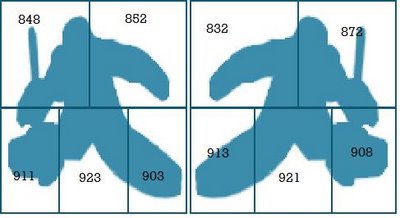
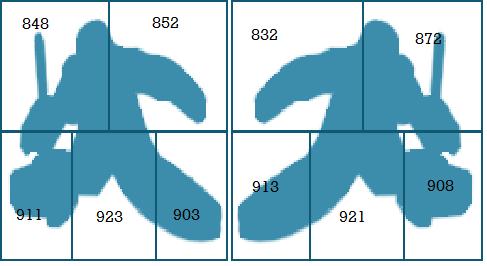
| Jonas Hiller | ANH | 848 | 4.12 | 7.9 | 932 |
| J. Giguere | ANH | 881 | 3.51 | 5.78 | 913 |
| Kari Lehtonen | ATL | 1086 | 3.68 | 6.07 | 923 |
| Johan Hedberg | ATL | 621 | 3.54 | 6.11 | 909 |
| Tim Thomas | BOS | 1266 | 3.55 | 5.92 | 940 |
| Manny Fernandez | BOS | 619 | 4.68 | 6.78 | 927 |
| N. Khabibulin | CHI | 862 | 4.52 | 7.54 | 932 |
| Cristobal Huet | CHI | 760 | 3.94 | 5.92 | 917 |
| Peter Budaj | COL | 1154 | 4.59 | 6.06 | 906 |
| Andrew Raycroft | COL | 650 | 3.38 | 6.61 | 909 |
| Ty Conklin | DET | 779 | 3.97 | 7.7 | 920 |
| Chris Osgood | DET | 894 | 5.25 | 6.48 | 904 |
| Tomas Vokoun | FLA | 1463 | 4.98 | 8.2 | 935 |
| Craig Anderson | FLA | 726 | 4.26 | 6.74 | 928 |
| Jonathan Quick | LA | 875 | 3.08 | 5.71 | 923 |
| Erik Ersberg | LA | 471 | 3.18 | 5.09 | 912 |
| Carey Price | MON | 1115 | 3.76 | 5.91 | 921 |
| Jaroslav Halak | MON | 814 | 3.43 | 6.38 | 923 |
| Scott Clemmensen | NJ | 869 | 3.79 | 5.06 | 927 |
| Martin Brodeur | NJ | 629 | 5.08 | 6.67 | 934 |
| Pekka Rinne | NSH | 1173 | 4.17 | 6.64 | 927 |
| Dan Ellis | NSH | 678 | 4.27 | 6.48 | 918 |
| Yann Danis | NYI | 695 | 3.45 | 5.75 | 922 |
| Joey MacDonald | NYI | 1168 | 4.1 | 5.99 | 906 |
| Alex Auld | OTT | 829 | 4.22 | 6.75 | 920 |
| Brian Elliott | OTT | 601 | 3.49 | 5.65 | 920 |
| Mike Smith | TB | 883 | 3.85 | 5.77 | 929 |
| Karri Ramo | TB | 498 | 3.21 | 7.22 | 913 |
Labels: Goaltending
Goaltender Rebound Percentage Leaders
In his work on Shot Quality, Alan Ryder noted that shooting percentage is extremely high on rebounds. That is, in the two seconds following another shot. The overall save percentages for 2008-09:
After four seconds, shooting percentages are in the low-to-mid 900s. So it is significant to look at what percentage of a goalie's shots are rebounds allowed less than 2, 3 and 4 seconds after a previous shot. Here are the league "leaders":
And at the other end:
| Overall | 1-2 s | 3 s | 4 s |
| 919 | 694 | 807 | 892 |
After four seconds, shooting percentages are in the low-to-mid 900s. So it is significant to look at what percentage of a goalie's shots are rebounds allowed less than 2, 3 and 4 seconds after a previous shot. Here are the league "leaders":
| Goalie | PCT<2s | PCT<3s | PCT<4s |
| EVGENI NABOKOV | 5.52 | 6 | 7.61 |
| MIIKKA KIPRUSOFF | 5.33 | 6.24 | 8.25 |
| CAM WARD | 5.31 | 6.38 | 7.09 |
| CHRIS OSGOOD | 5.25 | 5.59 | 6.48 |
| MATHIEU GARON | 5.19 | 5.73 | 6.55 |
| MICHAEL LEIGHTON | 5.16 | 6.25 | 7.06 |
| MARTIN BRODEUR | 5.08 | 5.72 | 6.67 |
| TOMAS VOKOUN | 4.98 | 6.63 | 8.2 |
| MANNY FERNANDEZ | 4.68 | 5.81 | 6.78 |
| PETER BUDAJ | 4.59 | 5.37 | 6.06 |
And at the other end:
| Goalie | PCT<2s | PCT<3s | PCT<4s |
| CHRIS MASON | 3.25 | 4.42 | 5.96 |
| STEVE MASON | 3.24 | 4.43 | 6.22 |
| KARRI RAMO | 3.21 | 5.22 | 7.22 |
| ERIK ERSBERG | 3.18 | 4.67 | 5.09 |
| JONATHAN QUICK | 3.08 | 3.77 | 5.71 |
| JASON LABARBERA | 3 | 4.6 | 5.61 |
| RYAN MILLER | 2.84 | 3.84 | 5.76 |
| BRENT JOHNSON | 2.69 | 3.92 | 4.9 |
| MARTIN GERBER | 2.6 | 3.9 | 4.72 |
| JOSH HARDING | 1.79 | 3.58 | 5.67 |
Labels: Goaltending
Monday, June 1, 2009
New Puck Prospectus Post: The Right Guy in Goal
http://puckprospectus.com/article.php?articleid=160
"With an unproven goalie, teams can not tolerate a losing streak, so newly-arrived goaltenders have to play well immediately in the NHL. The difference between an NHL All-Star and a fringe goaltender is approximately one goal every other game. It doesn't matter that it might take 60 or 70 games to tell whether a goaltender has a true talent save percentage of .910 or .900 - if he plays poorly in his first 10 or 20 games, he gets sent down and somebody else gets a chance."
"With an unproven goalie, teams can not tolerate a losing streak, so newly-arrived goaltenders have to play well immediately in the NHL. The difference between an NHL All-Star and a fringe goaltender is approximately one goal every other game. It doesn't matter that it might take 60 or 70 games to tell whether a goaltender has a true talent save percentage of .910 or .900 - if he plays poorly in his first 10 or 20 games, he gets sent down and somebody else gets a chance."
Labels: Goaltending, Puck Prospectus
Wednesday, April 29, 2009
Shooting Percentage by Location of Directed Shot
Here's the save percentage by right- and left-handed goalies during the 2008-09 season:
I'll admit that I'm not completely sure what's interesting about this data - I have it for every goaltender and every shooter - so if you've got a good idea, send it my way.
Update: Hockey Numbers was all over this back in 2007. The 2006-07 data is no longer available, oddly enough.
I'll admit that I'm not completely sure what's interesting about this data - I have it for every goaltender and every shooter - so if you've got a good idea, send it my way.
Update: Hockey Numbers was all over this back in 2007. The 2006-07 data is no longer available, oddly enough.
Labels: Goaltending
Friday, April 24, 2009
2008-09 5v5 Goaltender Performance
Last year, I posted my methodology for calculating the quality of shots faced by a goaltender, along with the results of this analysis.
The 2008-09 results are below (minimum 700 minutes played at 5v5). The last column, DELTAGAA, shows how much lower a goaltender's Goals-Against-Average was than we would expect it to be given the shots he faced. Henrik Lundqvist, Tim Thomas and Jonas Hiller are the only goaltenders who appear in the Top 10 both this year and last year.
At any rate, here are the top 10:
Full stats for this season and last available at: http://www.behindthenet.ca/2008/5_on_5_goalie_shot_quality.php?sort=10
The 2008-09 results are below (minimum 700 minutes played at 5v5). The last column, DELTAGAA, shows how much lower a goaltender's Goals-Against-Average was than we would expect it to be given the shots he faced. Henrik Lundqvist, Tim Thomas and Jonas Hiller are the only goaltenders who appear in the Top 10 both this year and last year.
At any rate, here are the top 10:
NAME                GP   SPCT   GAA    ExSPT  ExGAA   DELTAGAA
TIM THOMAS          54   937    1.87   911    2.64     -0.77
NIKOLAI KHABIBULIN  42   927    1.94   902    2.64     -0.70
ROBERTO LUONGO      54   931    1.90   906    2.59     -0.69
HENRIK LUNDQVIST    69   913    2.38   890    3.00     -0.63
TOMAS VOKOUN        59   931    2.25   913    2.84     -0.59
KARI LEHTONEN       46   917    2.73   900    3.29     -0.56
JONAS HILLER        46   927    1.90   906    2.46     -0.56
MARTIN BRODEUR      31   930    1.90   912    2.38     -0.49
CRAIG ANDERSON      31   922    2.62   909    3.09     -0.47
MANNY FERNANDEZ     28   921    2.18   905    2.64     -0.45
Full stats for this season and last available at: http://www.behindthenet.ca/2008/5_on_5_goalie_shot_quality.php?sort=10
Labels: Goaltending, Shooting
Sunday, June 15, 2008
2007-08 5v5 Goaltender Performance (Full Season)
I finally ran the full-season's worth of shot quality/goaltending statistics (see Mid-Season stats.) There was some discussion over at James Mirtle's site, with some people claiming that Evgeni Nabokov was deserving of the Vezina Trophy - and not Martin Brodeur. The stats don't bear that out:
Brodeur faced tougher shots than Nabokov, and did a way better job of stopping them. There's no way to argue from a shot quality perspective that Nabokov deserves the award.
Here's the rest of the league, minimum 20 GP:
Nabokov Expected Save PCT 909, Actual 908 - GAA 0.03 higher than average goaltender
Brodeur Expected Save PCT 906, Actual 920 - GAA 0.34 *lower* than average goaltender
Brodeur faced tougher shots than Nabokov, and did a way better job of stopping them. There's no way to argue from a shot quality perspective that Nabokov deserves the award.
Here's the rest of the league, minimum 20 GP:
           GP TOI     SOG  GA SPCT GAA  EGA  ESPT EGAA DELTAGAA
DUBIELEWICZ20 787:01  394  31  921 2.36 41.1  895 3.13 -0.77
LUNDQVIST  72 3063:24 1201 99  917 1.94 137   885 2.68 -0.74
GIGUERE    58 2287:15 1001 65  935 1.71 92.97 907 2.44 -0.73
HILLER     23 863:21  354  27  923 1.88 37.02 895 2.57 -0.7
FLEURY     35 1285:49 614  41  933 1.91 53.92 912 2.52 -0.6
THOMAS     57 2465:18 1186 83  930 2.02 105.8 910 2.58 -0.56
CONKLIN    33 1311:57 714  47  934 2.15 58.5  918 2.68 -0.53
BRYZGALOV  64 2578:31 1266 91  928 2.12 112.3 911 2.61 -0.5
PRICE      41 1669:29 837  63  924 2.26 75.77 909 2.72 -0.46
LEHTONEN   48 1953:15 1066 88  917 2.7  102.2 904 3.14 -0.43
HUET       52 2170:39 1013 77  923 2.13 91.53 909 2.53 -0.4
BRODEUR    77 3392:35 1386 110 920 1.95 129.5 906 2.29 -0.34
LEGACE     66 2616:37 1084 88  918 2.02 102.4 905 2.35 -0.33
HASEK      41 1587:27 545  42  922 1.59 50.68 907 1.92 -0.33
ELLIS      44 1584:18 805  62  922 2.35 70.76 912 2.68 -0.33
TELLQVIST  22 871:55  413  33  920 2.27 37.57 909 2.59 -0.31
KHABIBULIN 50 1943:04 850  77  909 2.38 86.75 897 2.68 -0.3
OSGOOD     43 1728:03 663  58  912 2.01 66.61 899 2.31 -0.3
AULD       32 1199:26 520  42  919 2.1  47.57 908 2.38 -0.28
VOKOUN     69 2910:13 1510 122 919 2.52 134.5 910 2.77 -0.26
LUONGO     73 2908:45 1318 103 921 2.12 115.7 912 2.39 -0.26
GERBER     57 2248:37 1086 94  913 2.51 103.2 905 2.75 -0.24
BIRON      62 2427:39 1241 95  923 2.35 103.5 916 2.56 -0.21
DIPIETRO   63 2631:01 1173 106 909 2.42 114.4 902 2.61 -0.19
LALIME     32 1267:26 561  54  903 2.56 57.76 897 2.73 -0.18
NIITTYMAKI 28 938:43  474  45  905 2.88 47.46 899 3.03 -0.16
THEODORE   53 2243:30 967  87  910 2.33 92.65 904 2.48 -0.15
LABARBERA  45 1721:56 945  86  908 3.00 90.3  904 3.15 -0.15
TOSKALA    66 2720:58 1201 111 907 2.45 116.6 902 2.57 -0.12
KIPRUSOFF  76 3087:15 1379 118 914 2.29 123.7 910 2.40 -0.11
WARD       69 2718:41 1233 113 908 2.49 117.6 904 2.60 -0.1
LECLAIRE   54 2075:24 880  67  923 1.94 70.49 919 2.04 -0.1
TURCO      62 2556:30 1022 91  910 2.14 94.91 907 2.23 -0.09
MILLER     76 3130:07 1399 122 912 2.34 125.8 910 2.41 -0.07
BUDAJ      35 1405:13 587  52  911 2.22 52.53 910 2.24 -0.02
BACKSTROM  58 2441:35 1110 90  918 2.21 89.42 919 2.20 0.01
NABOKOV    77 3266:15 1190 109 908 2 10 7.49  909 1.97 0.03
NORRENA    37 1359:34 548  57  895 2.52 53.55 902 2.36 0.15
HARDING    29 1141:15 578  54  906 2.84 51.01 911 2.68 0.16
RAMO       22 954:17  453  46  898 2.89 43.27 904 2.72 0.17
MASON      51 1902:51 850  86  898 2.71 80.27 905 2.53 0.18
SABOURIN   24 854:58  383  38  900 2.67 35.36 907 2.48 0.19
KOLZIG     54 2292:20 929  98  894 2.57 89.88 903 2.35 0.21
SMITH      34 1433:34 597  64  892 2.68 58.21 902 2.44 0.24
ROLOSON    43 1670:23 795  79  900 2.84 71.72 909 2.58 0.26
EMERY      31 1205:08 505  52  897 2.59 46.44 908 2.31 0.28
GARON      47 1848:13 882  87  901 2.82 78.14 911 2.54 0.29
HEDBERG    36 1384:59 676  73  892 3.16 64.26 904 2.78 0.38
HOLMQVIST  47 1932:04 760  91  880 2.83 68.73 909 2.13 0.69
TOIVONEN   23 842:20  359  51  857 3.63 38.76 892 2.76 0.87
Labels: Goaltending, Shooting
Monday, December 24, 2007
2007-08 4v5 Goaltender Performance
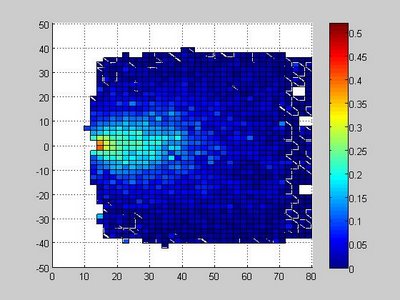
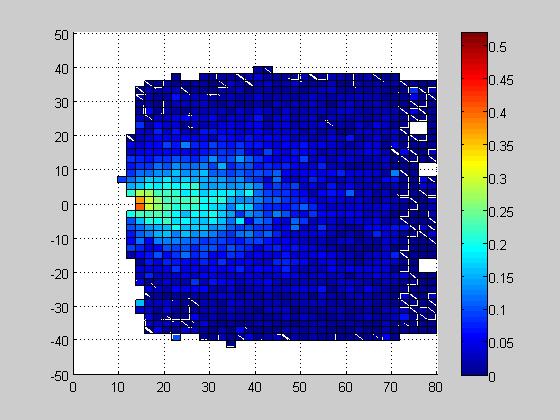
Scoring rates go way up on the power-play, making it a goaltender's toughest assignment. (Ray Emery fighting Andrew Peters doesn't count.) To quantify the difference, here's the same plot as we had for 5-on-5 play, except for 5-on-4:
As you can see, the high-scoring zone is much larger than it is for even-strength play. You can also see that teams don't take a lot of shots from tough angles (I excluded any quadrants with fewer than 10 shots in the last six seasons, resulting in some blank zones). So not only is it easier to score from a given spot on the ice, teams also take more high-probability shots, and average save percentages drop from 915 to 877.
I've reproduced the same chart as in the previous post, showing which goalies reduce their 4v5 goals-against-average by the most. Here we have a minimum of 30 minutes played, so one or two goals can skew the results considerably. Henrik Lundqvist again comes out near the top - is he really that good? Or do MSG scorers consistently report that the puck is shot from closer than it really is? [That's a subject for another post.]
| PLAYER | GP | TOI | SOG | GA | SPCT | GAA | EXGA | EXSPCT | EGAA | DELTAGAA |
| MIKESMITH | 12 | 62:55 | 55 | 4 | 927 | 3.81 | 8.31 | 848 | 7.92 | -4.11 |
| MATHIEUGARON | 18 | 88:58 | 75 | 6 | 920 | 4.04 | 10.8 | 855 | 7.30 | -3.25 |
| FREDRIKNORRENA | 15 | 78:01 | 70 | 4 | 942 | 3.07 | 8.21 | 882 | 6.31 | -3.23 |
| MARTYTURCO | 25 | 131:09 | 124 | 12 | 903 | 5.48 | 18.6 | 849 | 8.55 | -3.06 |
| JONASHILLER | 8 | 40:56 | 42 | 4 | 904 | 5.86 | 5.8 | 861 | 8.50 | -2.63 |
| HENRIKLUNDQVIST | 31 | 160:05 | 144 | 15 | 895 | 5.62 | 21.9 | 847 | 8.21 | -2.59 |
| CHRISOSGOOD | 19 | 105:43 | 80 | 7 | 912 | 3.97 | 11.5 | 855 | 6.55 | -2.58 |
| MIKAELTELLQVIST | 10 | 46:04 | 48 | 4 | 916 | 5.20 | 5.85 | 878 | 7.61 | -2.40 |
| CURTISSANFORD | 8 | 36:56 | 39 | 3 | 923 | 4.87 | 4.39 | 887 | 7.13 | -2.25 |
| TOMASVOKOUN | 32 | 179:50 | 179 | 17 | 905 | 5.67 | 23.4 | 869 | 7.82 | -2.14 |
| BRENTJOHNSON | 9 | 58:27 | 58 | 4 | 931 | 4.10 | 6.06 | 895 | 6.22 | -2.11 |
| NIKOLAIKHABIBULIN | 25 | 143:34 | 126 | 15 | 880 | 6.26 | 19.9 | 841 | 8.32 | -2.06 |
| HANNUTOIVONEN | 10 | 52:55 | 42 | 5 | 880 | 5.66 | 6.59 | 843 | 7.47 | -1.80 |
| MARTINBRODEUR | 30 | 158:20 | 172 | 18 | 895 | 6.82 | 22.6 | 868 | 8.56 | -1.74 |
| JASONLABARBERA | 22 | 96:47 | 113 | 14 | 876 | 8.67 | 16.6 | 852 | 10.3 | -1.66 |
| PASCALLECLAIRE | 23 | 121:46 | 132 | 14 | 893 | 6.89 | 16.9 | 871 | 8.37 | -1.47 |
| MARCDENIS | 10 | 37:04 | 32 | 4 | 875 | 6.47 | 4.8 | 850 | 7.76 | -1.29 |
| EVGENINABOKOV | 35 | 165:43 | 120 | 13 | 891 | 4.70 | 16.5 | 862 | 5.99 | -1.28 |
| MARTINGERBER | 24 | 150:51 | 120 | 13 | 891 | 5.17 | 16.0 | 866 | 6.37 | -1.20 |
| CAREYPRICE | 17 | 85:47 | 115 | 15 | 869 | 10.4 | 16.5 | 856 | 11.5 | -1.07 |
| JOHANHOLMQVIST | 30 | 139:18 | 145 | 17 | 882 | 7.32 | 19.3 | 866 | 8.33 | -1.01 |
| CRISTOBALHUET | 18 | 87:53 | 86 | 10 | 883 | 6.82 | 11.4 | 867 | 7.79 | -0.96 |
| DOMINIKHASEK | 18 | 129:34 | 94 | 13 | 861 | 6.02 | 15.0 | 840 | 6.96 | -0.94 |
| JOSETHEODORE | 15 | 70:08 | 52 | 6 | 884 | 5.13 | 7.09 | 863 | 6.06 | -0.93 |
| RICKDIPIETRO | 32 | 195:02 | 160 | 18 | 887 | 5.53 | 20.8 | 869 | 6.41 | -0.87 |
| DANELLIS | 14 | 70:05 | 55 | 6 | 890 | 5.13 | 6.95 | 873 | 5.95 | -0.81 |
| RYANMILLER | 31 | 188:19 | 163 | 19 | 883 | 6.05 | 20.8 | 872 | 6.62 | -0.57 |
| PATRICKLALIME | 10 | 59:23 | 43 | 6 | 860 | 6.06 | 6.52 | 848 | 6.58 | -0.52 |
| JOSHHARDING | 15 | 70:03 | 85 | 10 | 882 | 8.56 | 10.6 | 875 | 9.07 | -0.51 |
| ANDREWRAYCROFT | 10 | 46:52 | 49 | 6 | 877 | 7.68 | 6.39 | 869 | 8.18 | -0.49 |
| EMMANUELLEGACE | 23 | 141:07 | 85 | 10 | 882 | 4.25 | 11.1 | 869 | 4.73 | -0.48 |
| VESATOSKALA | 29 | 166:53 | 143 | 19 | 867 | 6.83 | 20.2 | 858 | 7.27 | -0.44 |
| TIMOTHY JR.THOMAS | 22 | 105:52 | 113 | 13 | 884 | 7.36 | 13.7 | 878 | 7.80 | -0.44 |
| NIKLASBACKSTROM | 22 | 129:46 | 109 | 14 | 871 | 6.47 | 14.4 | 867 | 6.67 | -0.19 |
| ROBERTOLUONGO | 29 | 164:10 | 161 | 22 | 863 | 8.04 | 22.4 | 860 | 8.21 | -0.17 |
| JOHANHEDBERG | 20 | 95:44 | 91 | 12 | 868 | 7.52 | 12.0 | 867 | 7.54 | -0.02 |
| OLAFKOLZIG | 28 | 160:23 | 168 | 22 | 869 | 8.23 | 21.9 | 869 | 8.22 | 0.003 |
| J-SEBASTIENAUBIN | 13 | 42:18 | 53 | 7 | 867 | 9.92 | 6.96 | 868 | 9.87 | 0.056 |
| RAYEMERY | 12 | 59:40 | 57 | 7 | 877 | 7.03 | 6.87 | 879 | 6.90 | 0.130 |
| ALEXAULD | 15 | 69:40 | 78 | 11 | 858 | 9.47 | 10.6 | 863 | 9.14 | 0.327 |
| DWAYNEROLOSON | 22 | 106:40 | 116 | 17 | 853 | 9.56 | 15.9 | 862 | 8.94 | 0.618 |
| CAMWARD | 27 | 146:32 | 144 | 22 | 847 | 9.00 | 19.9 | 861 | 8.15 | 0.855 |
| MARTINBIRON | 28 | 156:17 | 157 | 21 | 866 | 8.06 | 18.7 | 880 | 7.19 | 0.867 |
| KARILEHTONEN | 13 | 61:16 | 72 | 10 | 861 | 9.79 | 9.05 | 874 | 8.86 | 0.930 |
| DANYSABOURIN | 18 | 76:07 | 76 | 11 | 855 | 8.67 | 9.79 | 871 | 7.71 | 0.953 |
| ILJABRYZGALOV | 25 | 136:19 | 118 | 18 | 847 | 7.92 | 15.8 | 866 | 6.95 | 0.963 |
| CHRISMASON | 24 | 114:03 | 77 | 11 | 857 | 5.78 | 9.06 | 882 | 4.76 | 1.020 |
| JEAN-SEBASTIENGIGUERE | 27 | 159:32 | 156 | 24 | 846 | 9.02 | 21.0 | 864 | 7.92 | 1.101 |
| MARC-ANDREFLEURY | 21 | 98:20 | 104 | 16 | 846 | 9.76 | 13.5 | 869 | 8.28 | 1.482 |
| PETERBUDAJ | 22 | 91:38 | 86 | 15 | 825 | 9.82 | 12.2 | 857 | 8.00 | 1.813 |
| MIIKKAKIPRUSOFF | 35 | 204:31 | 166 | 29 | 825 | 8.50 | 21.3 | 871 | 6.25 | 2.250 |
| ANTERONIITTYMAKI | 8 | 35:56 | 34 | 7 | 794 | 11.6 | 5.08 | 850 | 8.48 | 3.205 |
| JOHNGRAHAME | 11 | 53:52 | 52 | 10 | 807 | 11.1 | 6.71 | 870 | 7.47 | 3.664 |
Labels: Goaltending
Sunday, December 23, 2007
2007-08 5v5 Goaltender Performance
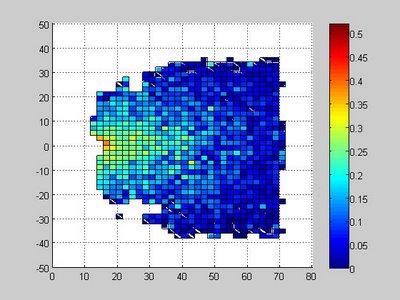
I've put together a simple first-order system to analyze goaltender performance. First, I calculated the probability of scoring from 2x2-foot quadrants using data from 2001 through last week's games:
I then took every shot faced by each goaltender and calculated the number of goals we'd expect an average goaltender to allow is he faced the exact same set of shots. [Note that shot distances are relative to the end boards, not to the goal line.] This is obviously a coarse estimate: we have no information on whether shots were defended or screened, and because of the difference in the way shot types are recorded in different arenas, I haven't differentiated between them. [Yes, in hopes of improving the system, I am happy to accept critical comments!]
At any rate, the table below shows the number of goals allowed by each NHL goaltender this season (minimum: 300 mins) and the expected number of goals allowed by an average goaltender.
So as an example, Henrik Lundqvist has allowed 41 goals on 567 shots at 5-on-5, for a 927 save percentage. However, an average goalie who faced the 567 shots from the same locations would expect to allow 58.3 goals, for an 897 save percentage. On a per-60-minute basis, Lundqvist's Goals-Against-Average is 1.90 - 0.80 goals lower than an average goalie. I'll publish some charts for individual goaltenders so we can compare the best goaltenders to the worst in this metric.
| PLAYER STATS | EXPECTED STATS | |||||||||
| PLAYER | GP | TOI | SOG | GA | SPCT | GAA | EXGA | EXSPCT | EGAA | DELTAGAA |
| TIMOTHY JR.THOMAS | 22 | 977:05 | 521 | 23 | 955 | 1.41 | 44.6 | 914 | 2.74 | -1.32 |
| HENRIKLUNDQVIST | 31 | 1289:26 | 567 | 41 | 927 | 1.90 | 58.3 | 897 | 2.71 | -0.80 |
| CRISTOBALHUET | 18 | 773:04 | 411 | 25 | 939 | 1.94 | 34.9 | 915 | 2.70 | -0.76 |
| ILJABRYZGALOV | 25 | 924:13 | 442 | 25 | 943 | 1.62 | 36.4 | 917 | 2.36 | -0.74 |
| CHRISOSGOOD | 19 | 797:26 | 337 | 22 | 934 | 1.65 | 31.7 | 905 | 2.39 | -0.73 |
| ROBERTOLUONGO | 29 | 1160:50 | 536 | 30 | 944 | 1.55 | 42.7 | 920 | 2.20 | -0.65 |
| MARTINGERBER | 24 | 964:07 | 542 | 38 | 929 | 2.36 | 48.1 | 911 | 2.99 | -0.62 |
| JASONLABARBERA | 22 | 889:57 | 477 | 37 | 922 | 2.49 | 44.3 | 906 | 2.99 | -0.49 |
| EMMANUELLEGACE | 23 | 934:54 | 394 | 28 | 928 | 1.79 | 35.6 | 909 | 2.28 | -0.48 |
| CAREYPRICE | 17 | 728:33 | 386 | 29 | 924 | 2.38 | 34.4 | 910 | 2.83 | -0.44 |
| MARTINBIRON | 28 | 1088:09 | 615 | 41 | 933 | 2.26 | 48.8 | 920 | 2.69 | -0.43 |
| JEAN-SEBASTIENGIGUERE | 27 | 1013:22 | 433 | 31 | 928 | 1.83 | 37.7 | 912 | 2.23 | -0.39 |
| CAMWARD | 27 | 1086:42 | 530 | 41 | 922 | 2.26 | 47.8 | 909 | 2.64 | -0.37 |
| RYANMILLER | 31 | 1254:29 | 602 | 45 | 925 | 2.15 | 51.9 | 913 | 2.48 | -0.33 |
| RICKDIPIETRO | 32 | 1283:57 | 601 | 46 | 923 | 2.14 | 52.4 | 912 | 2.44 | -0.29 |
| DANELLIS | 14 | 502:01 | 230 | 16 | 930 | 1.91 | 18.2 | 920 | 2.18 | -0.27 |
| TOMASVOKOUN | 32 | 1346:02 | 726 | 54 | 925 | 2.40 | 59.7 | 917 | 2.66 | -0.25 |
| VESATOSKALA | 29 | 1168:59 | 554 | 47 | 915 | 2.41 | 52.0 | 906 | 2.66 | -0.25 |
| PASCALLECLAIRE | 23 | 856:31 | 374 | 24 | 935 | 1.68 | 27.0 | 927 | 1.89 | -0.21 |
| NIKLASBACKSTROM | 22 | 894:17 | 394 | 28 | 928 | 1.87 | 30.8 | 921 | 2.07 | -0.19 |
| MIKAELTELLQVIST | 10 | 393:12 | 199 | 15 | 924 | 2.28 | 16.1 | 918 | 2.46 | -0.17 |
| ALEXAULD | 15 | 620:41 | 296 | 22 | 925 | 2.12 | 23.7 | 919 | 2.29 | -0.17 |
| EVGENINABOKOV | 35 | 1446:58 | 607 | 46 | 924 | 1.90 | 49.6 | 918 | 2.05 | -0.14 |
| FREDRIKNORRENA | 15 | 527:50 | 237 | 20 | 915 | 2.27 | 21.0 | 911 | 2.39 | -0.12 |
| MIIKKAKIPRUSOFF | 35 | 1438:23 | 660 | 54 | 918 | 2.25 | 56.8 | 913 | 2.37 | -0.11 |
| MARTINBRODEUR | 30 | 1286:11 | 531 | 44 | 917 | 2.05 | 46.4 | 912 | 2.16 | -0.11 |
| NIKOLAIKHABIBULIN | 25 | 970:42 | 421 | 39 | 907 | 2.41 | 40.4 | 903 | 2.49 | -0.08 |
| PATRICKLALIME | 10 | 390:04 | 167 | 15 | 910 | 2.30 | 15.4 | 907 | 2.37 | -0.07 |
| MARC-ANDREFLEURY | 21 | 760:41 | 388 | 32 | 917 | 2.52 | 32.4 | 916 | 2.55 | -0.03 |
| KARILEHTONEN | 13 | 472:40 | 250 | 22 | 912 | 2.79 | 22.2 | 911 | 2.82 | -0.03 |
| JOHNGRAHAME | 11 | 435:36 | 238 | 22 | 907 | 3.03 | 22.2 | 906 | 3.06 | -0.03 |
| PETERBUDAJ | 22 | 906:00 | 419 | 35 | 916 | 2.31 | 35.0 | 916 | 2.32 | -0.00 |
| MARTYTURCO | 25 | 1082:27 | 473 | 40 | 915 | 2.21 | 39.3 | 916 | 2.17 | 0.037 |
| JOSHHARDING | 15 | 579:25 | 313 | 25 | 920 | 2.58 | 23.6 | 924 | 2.45 | 0.138 |
| DOMINIKHASEK | 18 | 656:53 | 207 | 19 | 908 | 1.73 | 17.2 | 916 | 1.57 | 0.160 |
| MATHIEUGARON | 18 | 686:55 | 327 | 31 | 905 | 2.70 | 28.7 | 911 | 2.51 | 0.193 |
| RAYEMERY | 12 | 432:39 | 176 | 16 | 909 | 2.21 | 14.4 | 918 | 2.00 | 0.217 |
| CURTISSANFORD | 8 | 316:27 | 151 | 13 | 913 | 2.46 | 11.7 | 922 | 2.22 | 0.235 |
| OLAFKOLZIG | 28 | 1175:33 | 510 | 52 | 898 | 2.65 | 47.2 | 907 | 2.41 | 0.242 |
| DANYSABOURIN | 18 | 650:38 | 316 | 31 | 901 | 2.85 | 28.3 | 910 | 2.61 | 0.248 |
| DWAYNEROLOSON | 22 | 852:05 | 463 | 42 | 909 | 2.95 | 38.4 | 916 | 2.70 | 0.250 |
| CHRISMASON | 24 | 877:12 | 434 | 45 | 896 | 3.07 | 39.8 | 908 | 2.72 | 0.350 |
| BRENTJOHNSON | 9 | 344:40 | 165 | 17 | 896 | 2.95 | 14.7 | 910 | 2.57 | 0.386 |
| MIKESMITH | 12 | 465:48 | 206 | 22 | 893 | 2.83 | 18.9 | 907 | 2.44 | 0.387 |
| HANNUTOIVONEN | 10 | 394:32 | 195 | 22 | 887 | 3.34 | 19.1 | 901 | 2.90 | 0.436 |
| JOHANHEDBERG | 20 | 795:09 | 419 | 42 | 899 | 3.16 | 35.3 | 915 | 2.66 | 0.499 |
| JOSETHEODORE | 15 | 618:30 | 280 | 34 | 878 | 3.29 | 26.4 | 905 | 2.56 | 0.736 |
| JOHANHOLMQVIST | 30 | 1190:12 | 508 | 58 | 885 | 2.92 | 43.2 | 914 | 2.18 | 0.741 |
| J-SEBASTIENAUBIN | 13 | 427:15 | 214 | 24 | 887 | 3.37 | 17.9 | 916 | 2.52 | 0.848 |
| ANDREWRAYCROFT | 10 | 344:49 | 166 | 19 | 885 | 3.30 | 13.5 | 918 | 2.36 | 0.941 |
Labels: Goaltending
![]()
Subscribe to Posts [Atom]
