Tuesday, March 17, 2009
Shootout Length: Model vs Actual
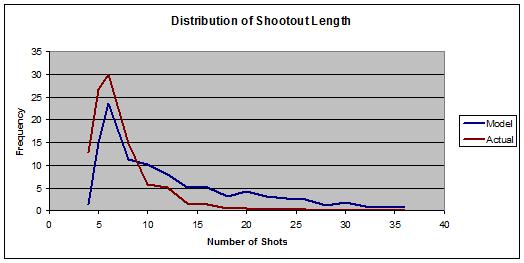
Here is the data from 2005-2009 shootouts compared to my simple model (assume all shooters have a 33% chance of scoring.) Short shootouts are far more likely to occur than predicted:
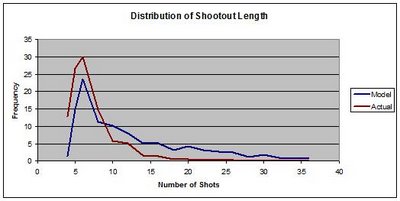
This isn't surprising - there is tremendous talent variation among shooters and goalies in the shootout. So the first two pairs of shots are often significantly tilted in one team's favor, leading to an early exit. Why does this inefficiency persist? Well, there aren't many options in goal, first of all. As for shooters, I haven't looked at shootout data in a long time, but initial returns indicated that coaches had not properly assessed the true shootout talent of their players. You'd have to take a lot of penalty shots in practice to figure out who's a 40% scorer and who's a 30% scorer, and for one or two points in the standings per season and no impact in the playoffs, it may not be worth the time.
This isn't surprising - there is tremendous talent variation among shooters and goalies in the shootout. So the first two pairs of shots are often significantly tilted in one team's favor, leading to an early exit. Why does this inefficiency persist? Well, there aren't many options in goal, first of all. As for shooters, I haven't looked at shootout data in a long time, but initial returns indicated that coaches had not properly assessed the true shootout talent of their players. You'd have to take a lot of penalty shots in practice to figure out who's a 40% scorer and who's a 30% scorer, and for one or two points in the standings per season and no impact in the playoffs, it may not be worth the time.
Labels: Shootouts
Monday, March 9, 2009
Average Number of Shots in the Shootout
A friend of mine asked me how many shots their were in an average shootout. I'll admit that I gave a wildly incorrect guess, but I wanted to know the answer to his question, so I wrote a little simulation to get the answer. Here's the average number of shots in the shootout versus the likelihood of scoring: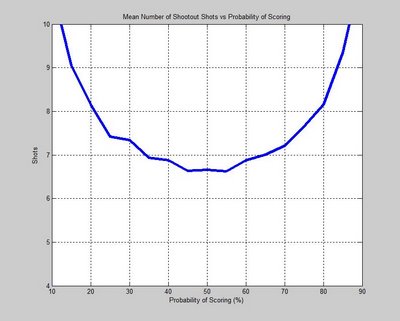
Intuitively, the trend makes sense: if you never score, the shootout will never end; the same is true if you always score.
How does the model compare to reality? The average scoring rate over the past four seasons in the NHL is 33.1% - the simulation predicts just slightly over seven shots on average. The real average has been 4058 shots in 588 shootouts, or 6.9.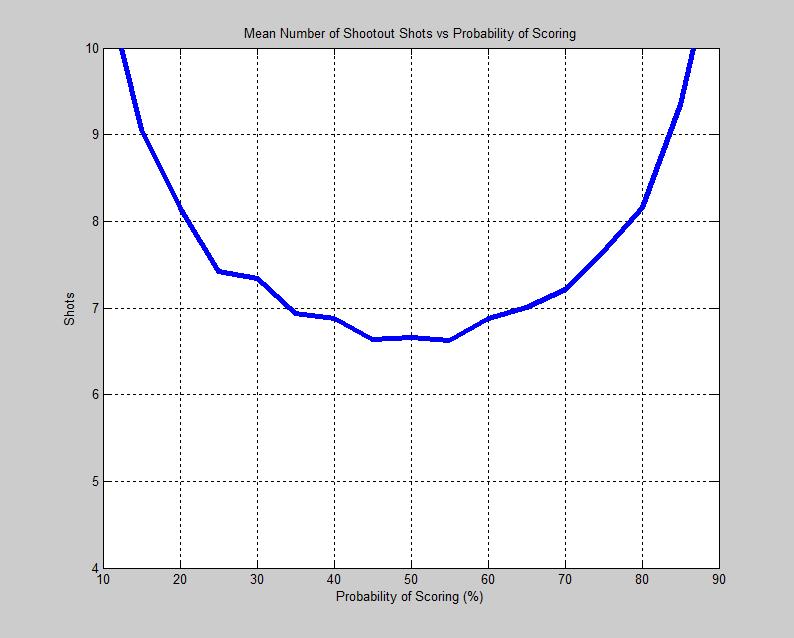
Labels: Shootouts, simulation
Wednesday, December 24, 2008
The dangers of Overtime Losses
While the shootout and the overtime loss have probably made the NHL more exciting for fans, the way they're presented in the standings has made it very difficult to determine how good a team is. Right now, game outcomes are grouped into Wins, Losses and Overtime Losses so that we can see how many points a team has, but nobody tracks whether a team won its game in regulation or in overtime or the shootout. Some teams, like last year's Edmonton Oilers, can get incredibly lucky in the extra frames, leading to a record that's way out of line with their actual performance. This is a very key piece of information - there's no correlation between OT/SO performance and overall performance, a fact that's acknowledged by playing overtime indefinitely in the playoffs to decide a winner.
Lots of people understand that overtime wins can lead us to erroneous conclusions about a team, including the people who put the Toronto Maple Leafs 24th in this week's ESPN Power Rankings:
"Break up the Leafs! They're at a misleading, OTL-skewed .500."
Except, in this case, it's not true. Toronto's 2-6 this year after regulation, which makes them 12-14-8 in regulation - tied eight times after 8. Their regulation GF/GA: 107-116, giving an expected winning percentage of 0.460, which translates to 31.26 points in the standings, or 0.75 points less than that 12-14-8 record would suggest.
The Leafs may be a lot of things, but skewed-record-holders, they ain't.
![]()
Subscribe to Posts [Atom]
